
Description
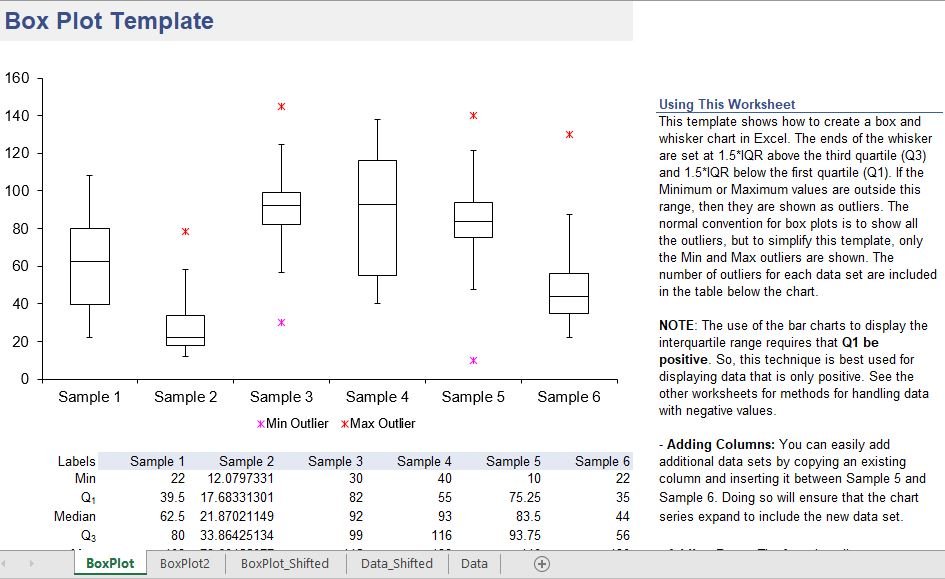
Box Plot – Excel Template
This Box Plot Excel template offers a professional way to visualize statistical data, making it easy to identify medians, quartiles, and outliers. Ideal for analysts, researchers, educators, and data-driven teams, this tool simplifies complex data sets into a clear and concise visual format.
Whether you’re presenting academic research, business analytics, or quality control metrics, this template provides a polished and functional solution for understanding data distribution.
Key Features:
-
Automatically generates box plots from input data
-
Highlights medians, quartiles, ranges, and outliers
-
Fully editable and formatted in Excel
-
Supports both single and comparative data sets
-
Ideal for statistics, business analysis, and academic use

Reviews
There are no reviews yet.