


Description
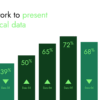
Turn complex data into clear insights.
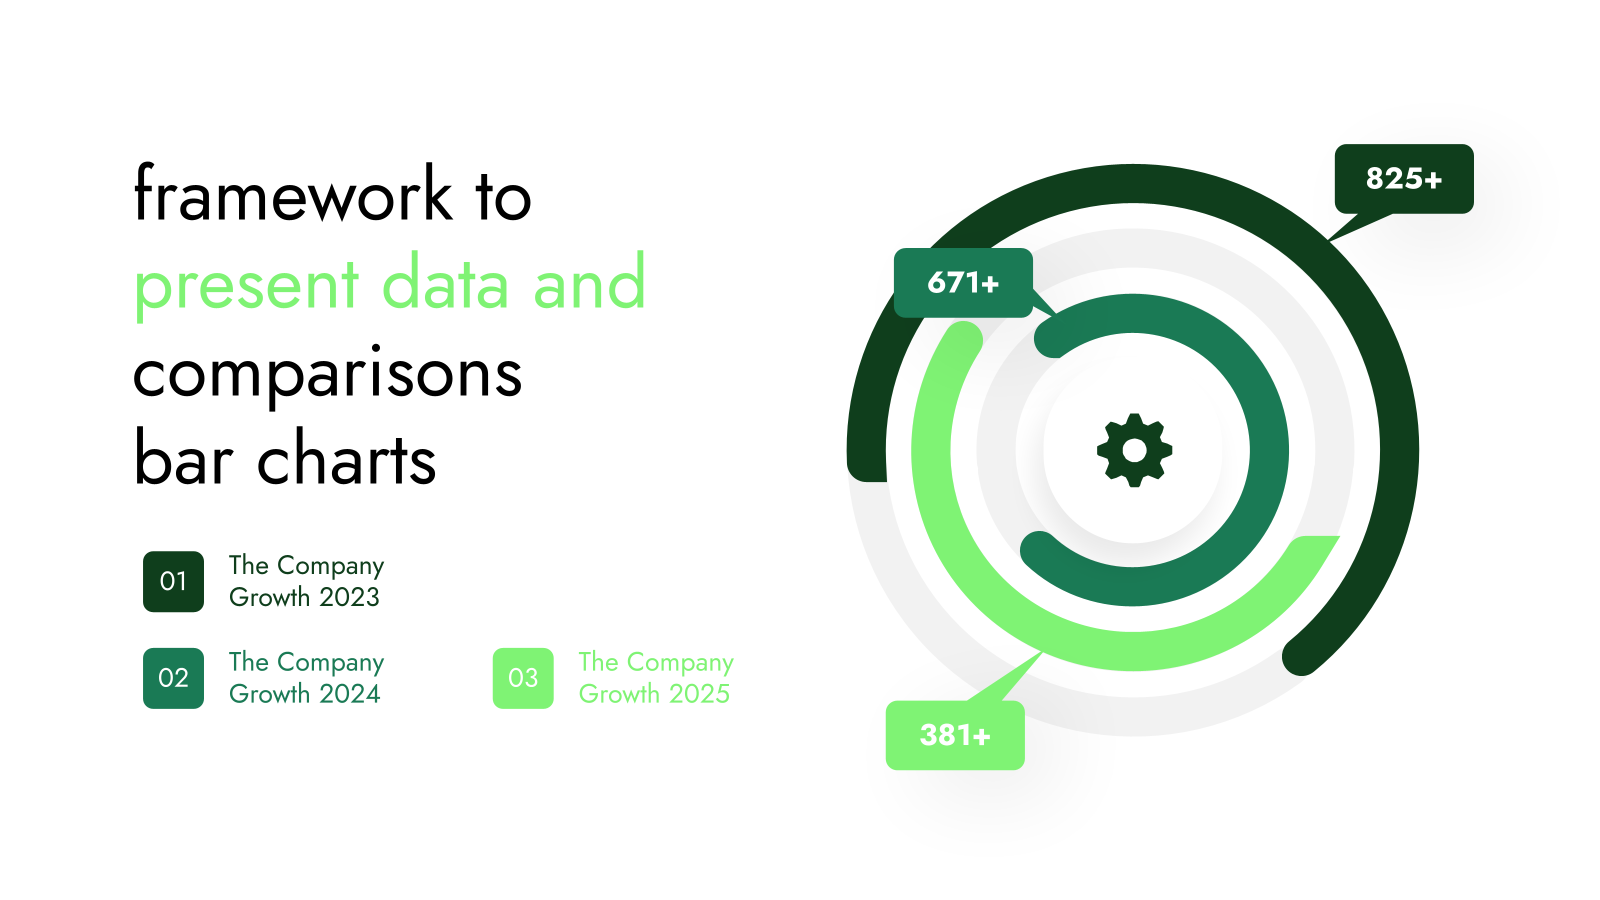
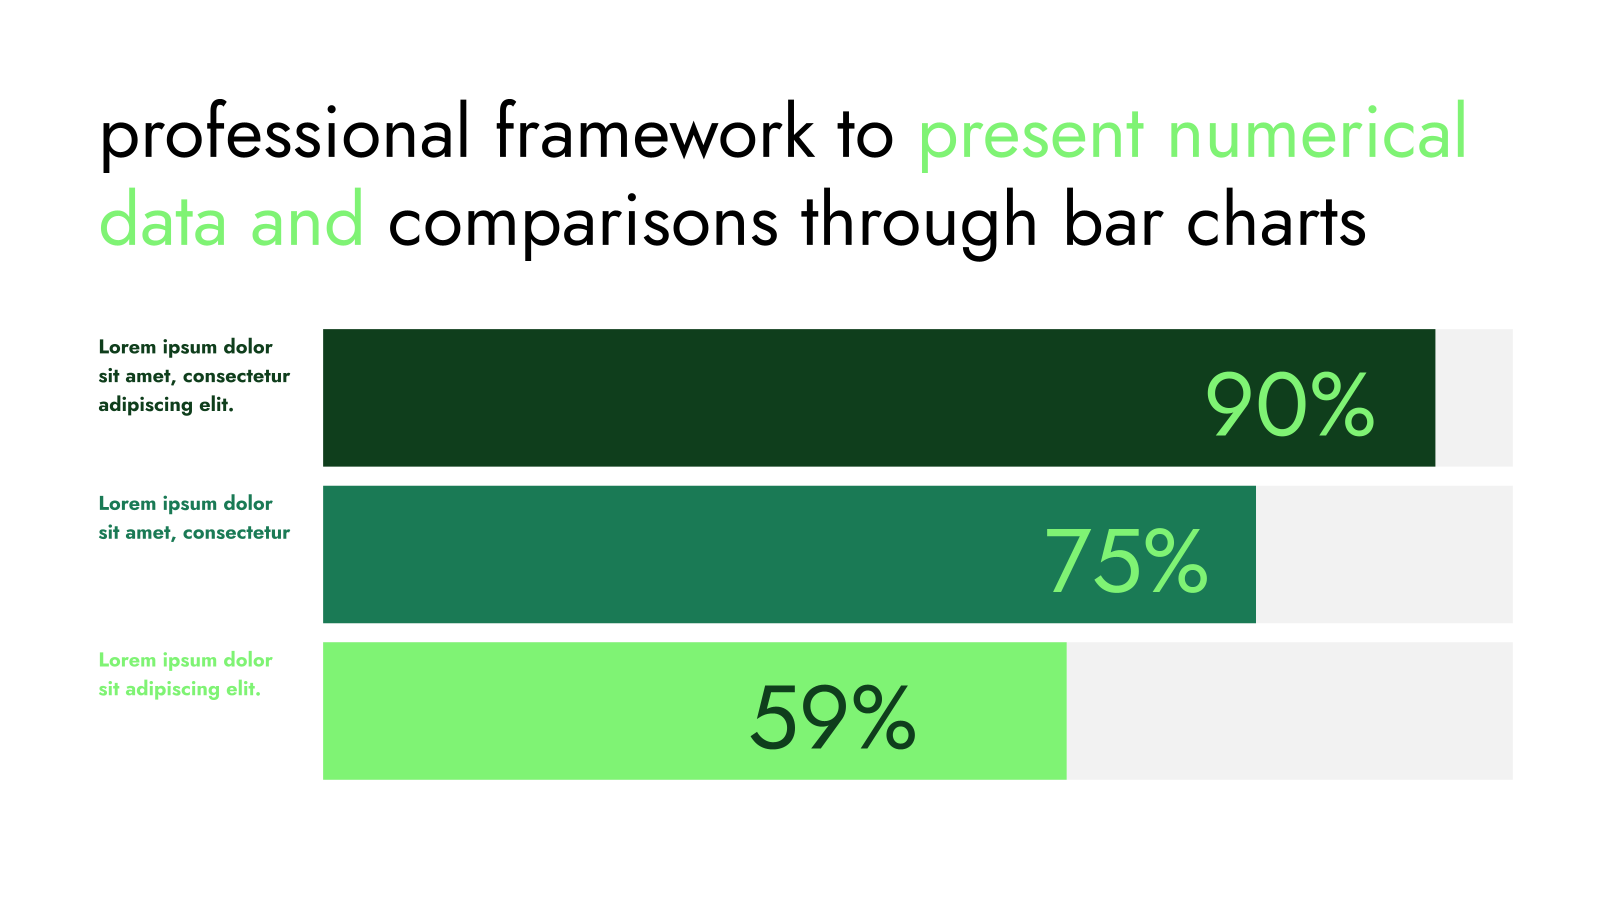
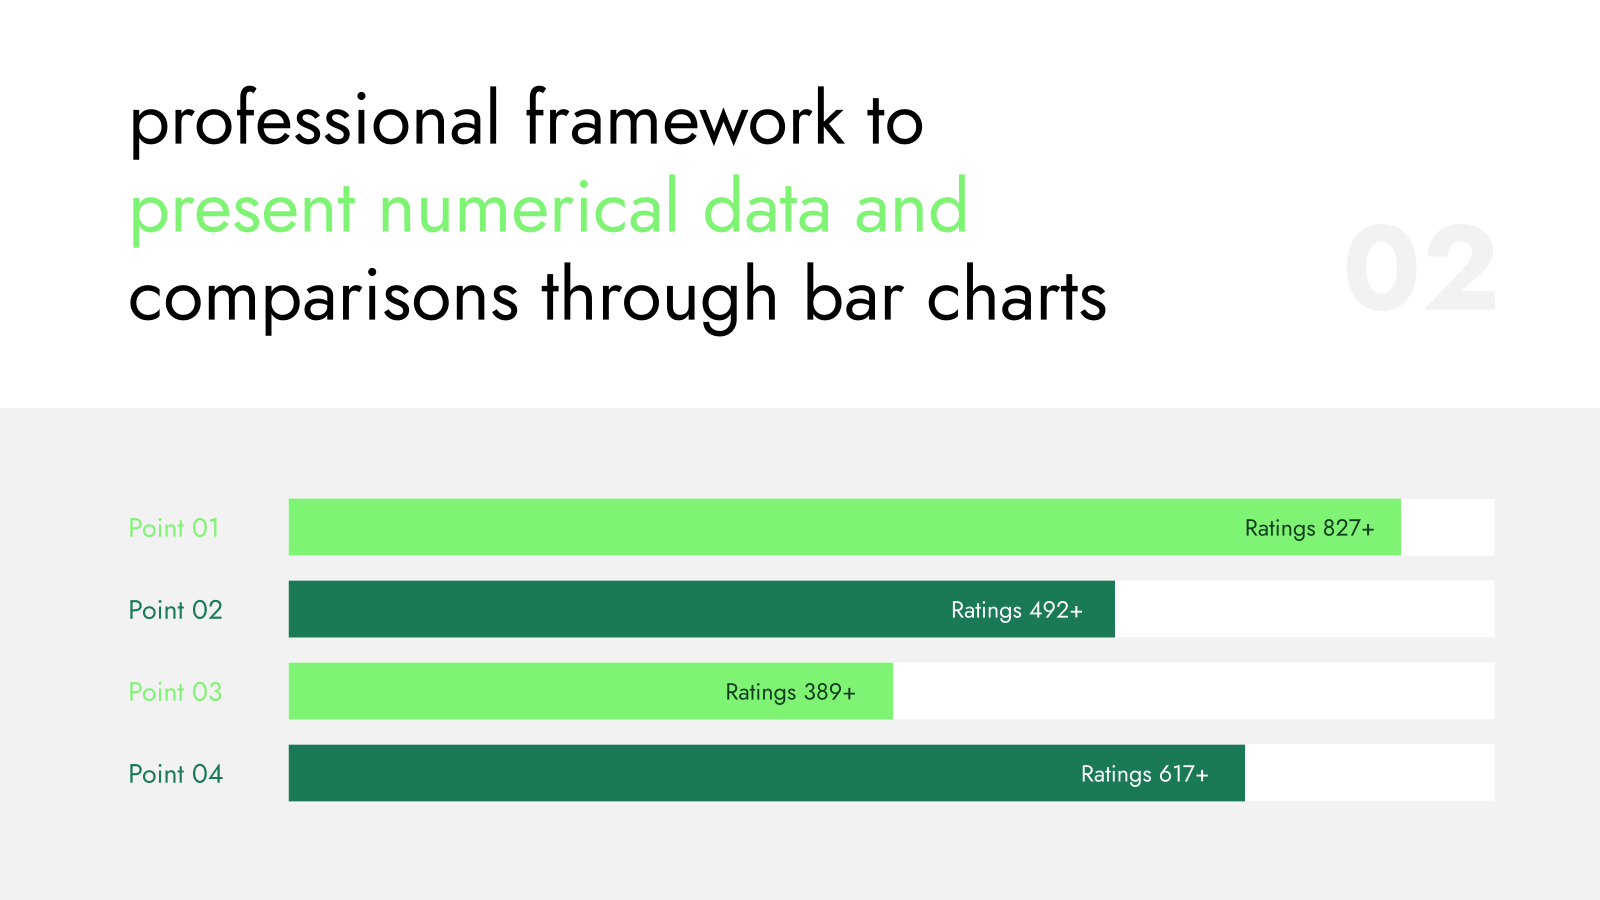
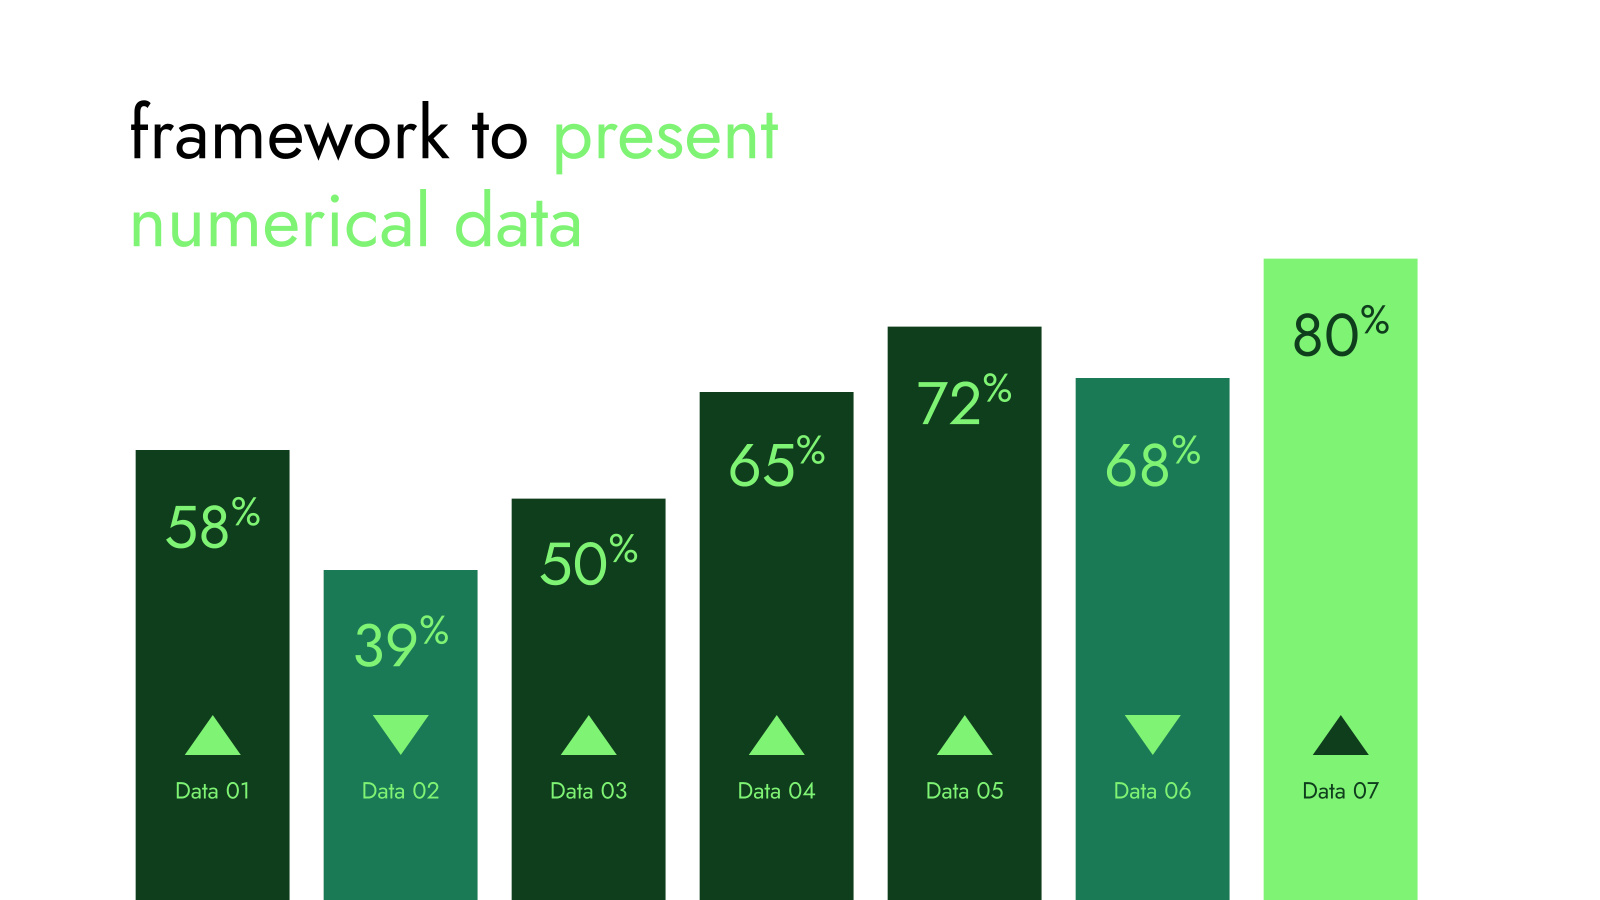
The Visual Data Analysis PowerPoint Template is crafted for analysts, marketers, and business professionals who need to present data visually and effectively. With clean, modern charts, graphs, and infographics, this template helps you communicate trends, results, and insights clearly.
Designed for easy customization, it’s perfect for quarterly reports, business reviews, and strategic presentations that require data-driven storytelling.
Features:
-
Fully editable in Microsoft PowerPoint
-
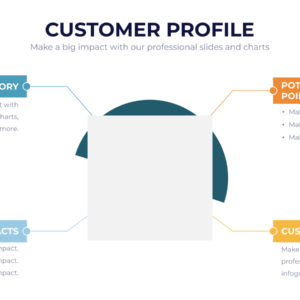
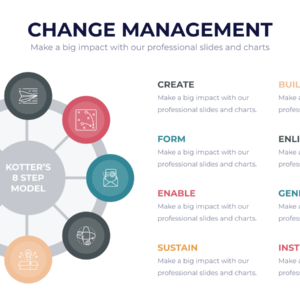
Includes charts, graphs, and infographic elements
-
Clean, professional design focused on data visualization
-
Ideal for business analysts, consultants, and marketing teams
Make your data easy to understand and your presentations more impactful.

Reviews
There are no reviews yet.