

Description
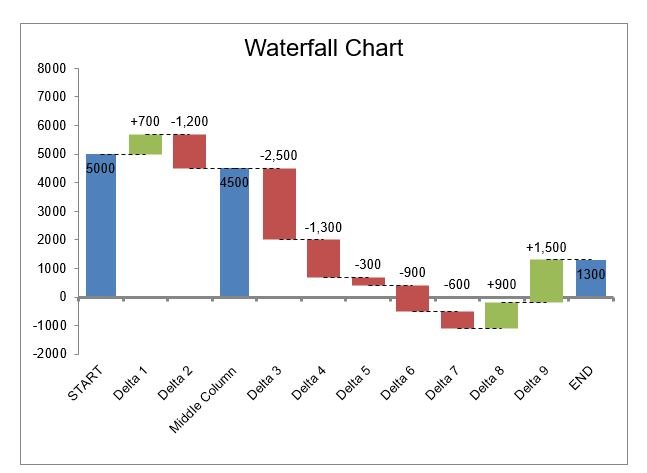
Waterfall Chart – Excel Template
This Waterfall Chart Excel template provides a clear visual representation of how an initial value is affected by a series of intermediate positive or negative values. Commonly used in finance and business analysis, this tool simplifies the understanding of changes over time or across categories.
Perfect for illustrating revenue breakdowns, budget variances, or project cost analysis, the template is easy to customize and ready to use for presentations and decision-making.
Key Features:
-
Automatically generates a waterfall chart from input data
-
Highlights positive, negative, and cumulative values
-
Customizable layout with clear data flow visualization
-
Suitable for financial modeling, business analysis, and reporting
-
Fully editable and presentation-ready in Excel