

Description
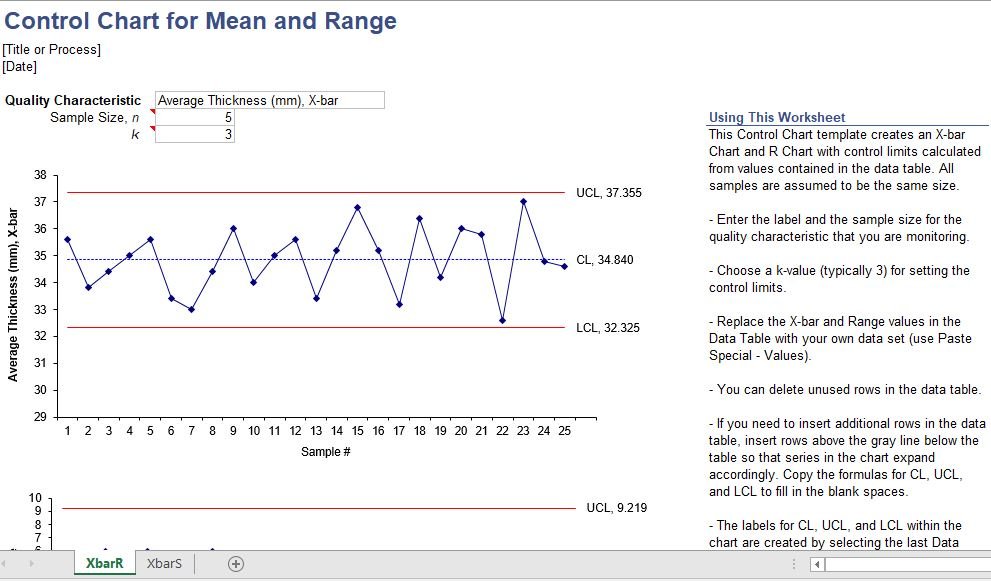
Control Chart – Excel Template
This Control Chart Excel template is designed for professionals and quality teams looking to monitor process stability and identify variations over time. With built-in calculations for control limits and visual indicators for trends, it simplifies statistical process control (SPC) and supports proactive decision-making.
Ideal for manufacturing, service industries, and operational oversight, this template helps detect issues early and maintain consistent quality.
Key Features:
-
Automatically plots data with upper, lower, and average control limits
-
Highlights points outside limits or showing unusual trends
-
Customizable input and chart settings
-
Supports variable or attribute data
-
Ideal for quality control, Six Sigma, and operational performance tracking

Reviews
There are no reviews yet.