
Description
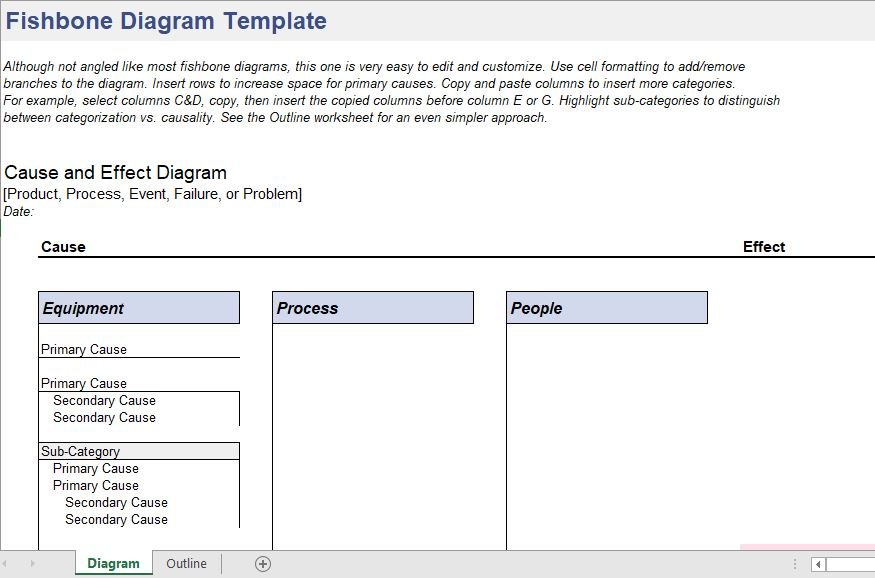
Fishbone Diagram – Excel Template
This professional Fishbone Diagram Excel template helps teams and individuals perform thorough root cause analysis by visually mapping out potential causes of a problem. Also known as an Ishikawa or Cause and Effect Diagram, this tool organizes causes into categories such as People, Process, Equipment, Materials, Environment, and Management.
Perfect for quality management, Lean Six Sigma, and operational improvement initiatives, this template simplifies structured problem-solving and supports data-driven decision-making.
Key Features:
-
Editable Fishbone layout with standard cause categories
-
Visual framework for identifying and analyzing root causes
-
Fully customizable and presentation-ready Excel format
-
Suitable for quality control, process improvement, and project troubleshooting
-
Ideal for business, manufacturing, education, and service industries

Reviews
There are no reviews yet.